"We found the dashboards extremely helpful when briefing elected members."
Mark Rizk

Move beyond the traditional report
Select a demo below to see what is possible...
Dashboards can bring reports, evidence and analysis to life, making findings easier for you and your stakeholders to explore and understand.
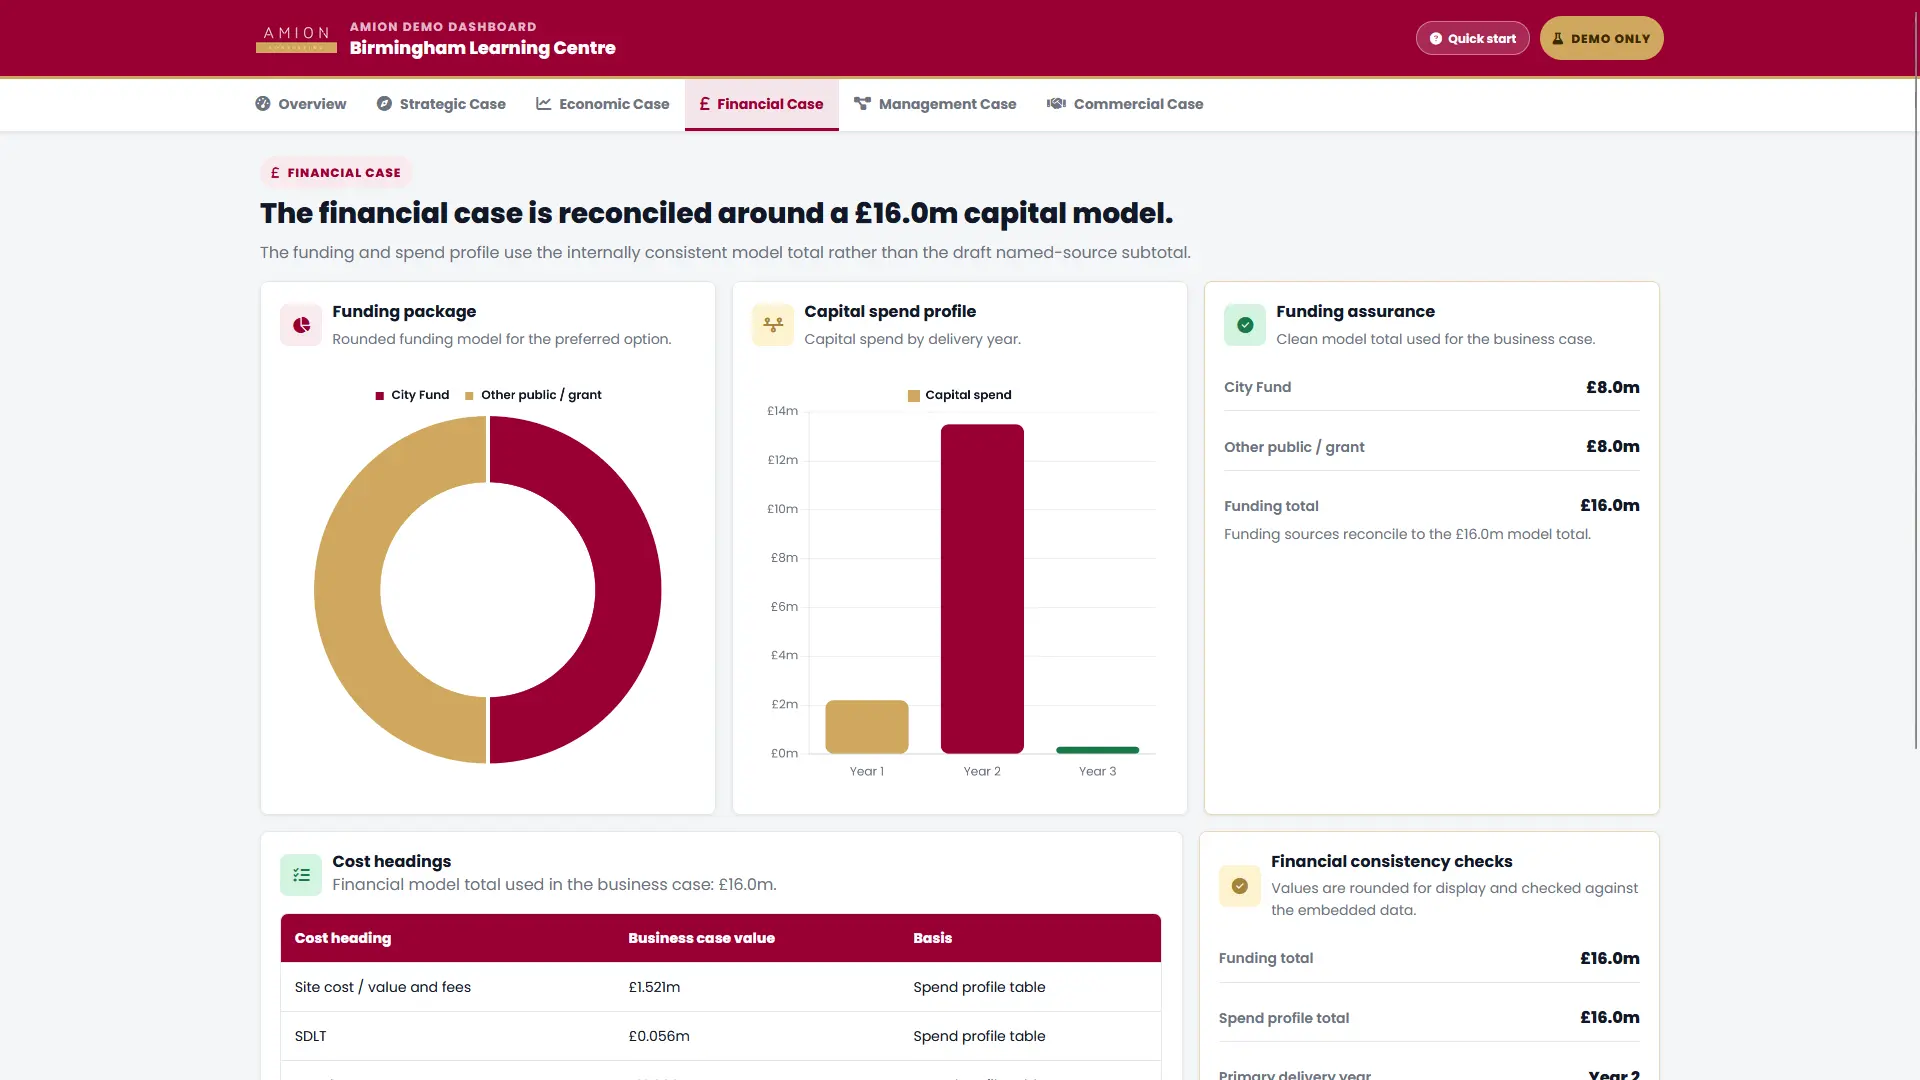
Present the Five Case Model in a clear, navigable format for stakeholder review and decision-making.
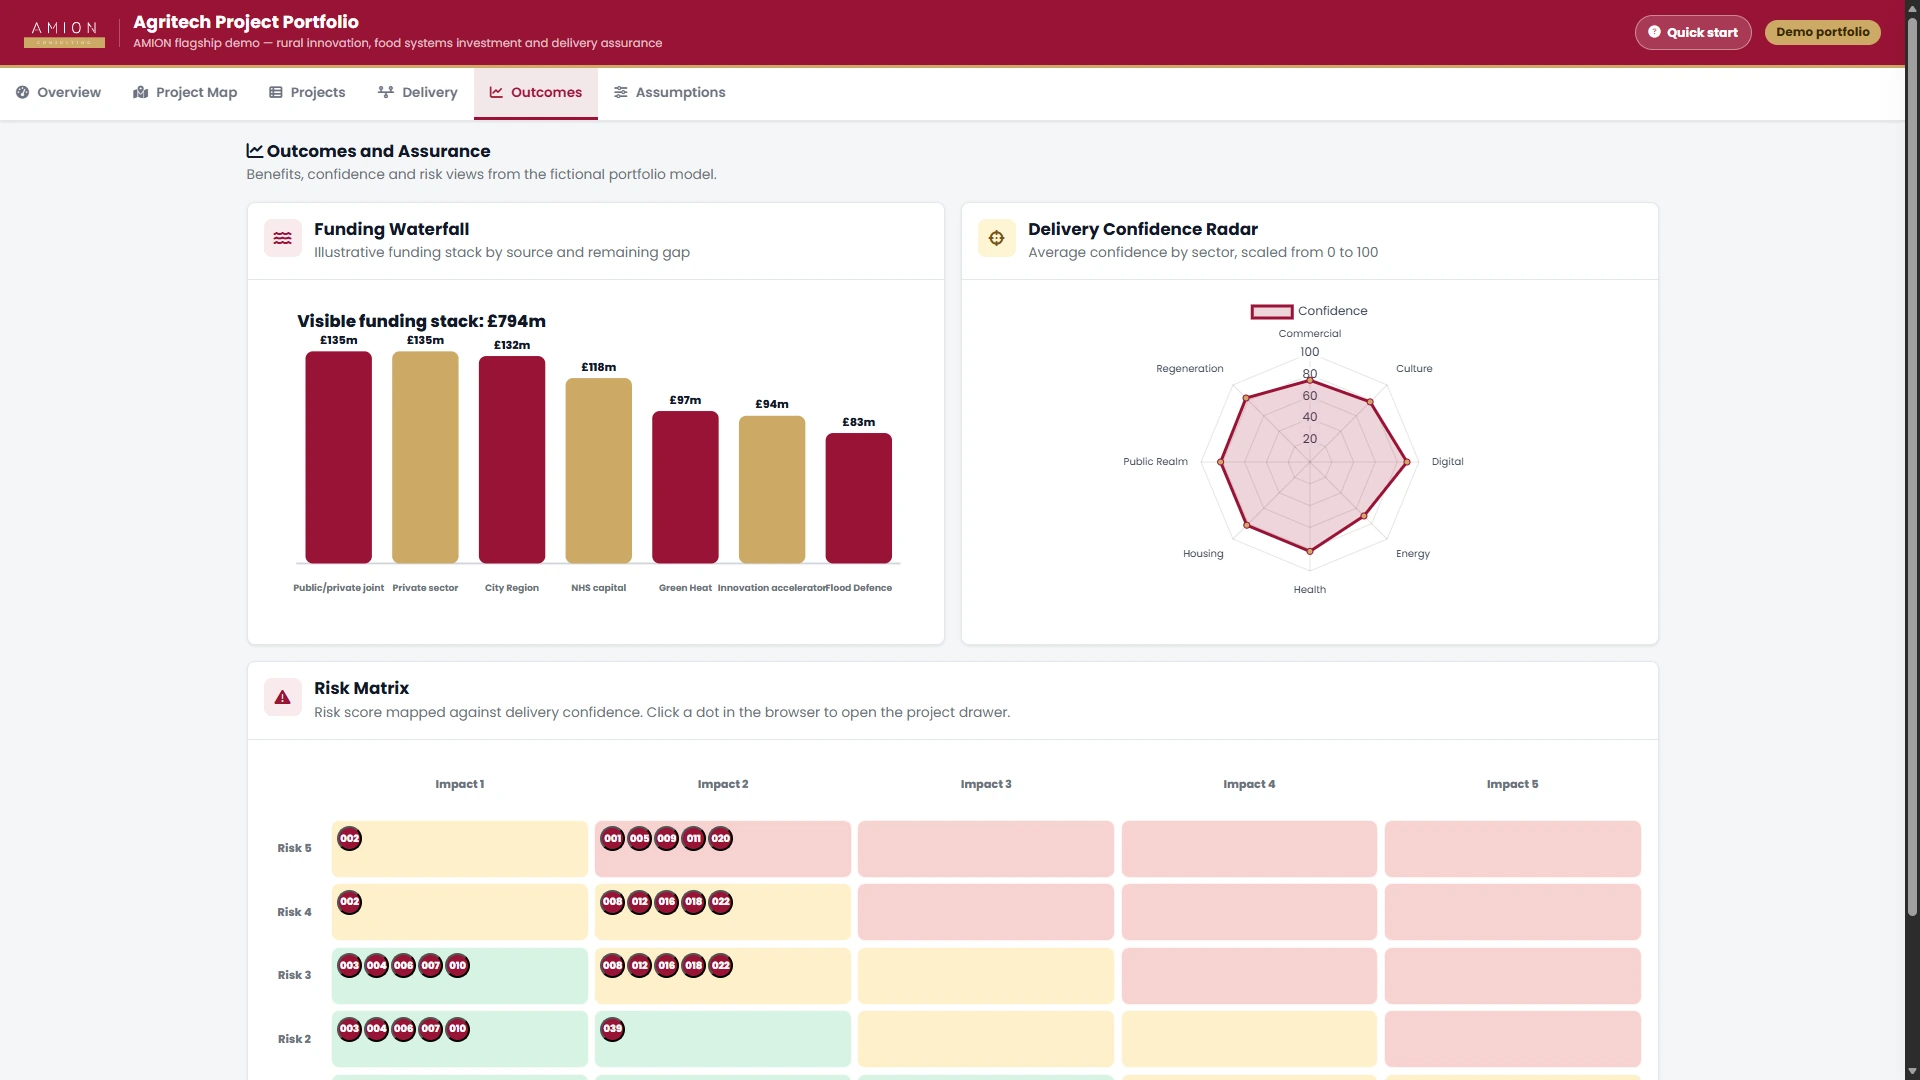
Track project status, investment, delivery progress and outputs across a whole programme in one place.
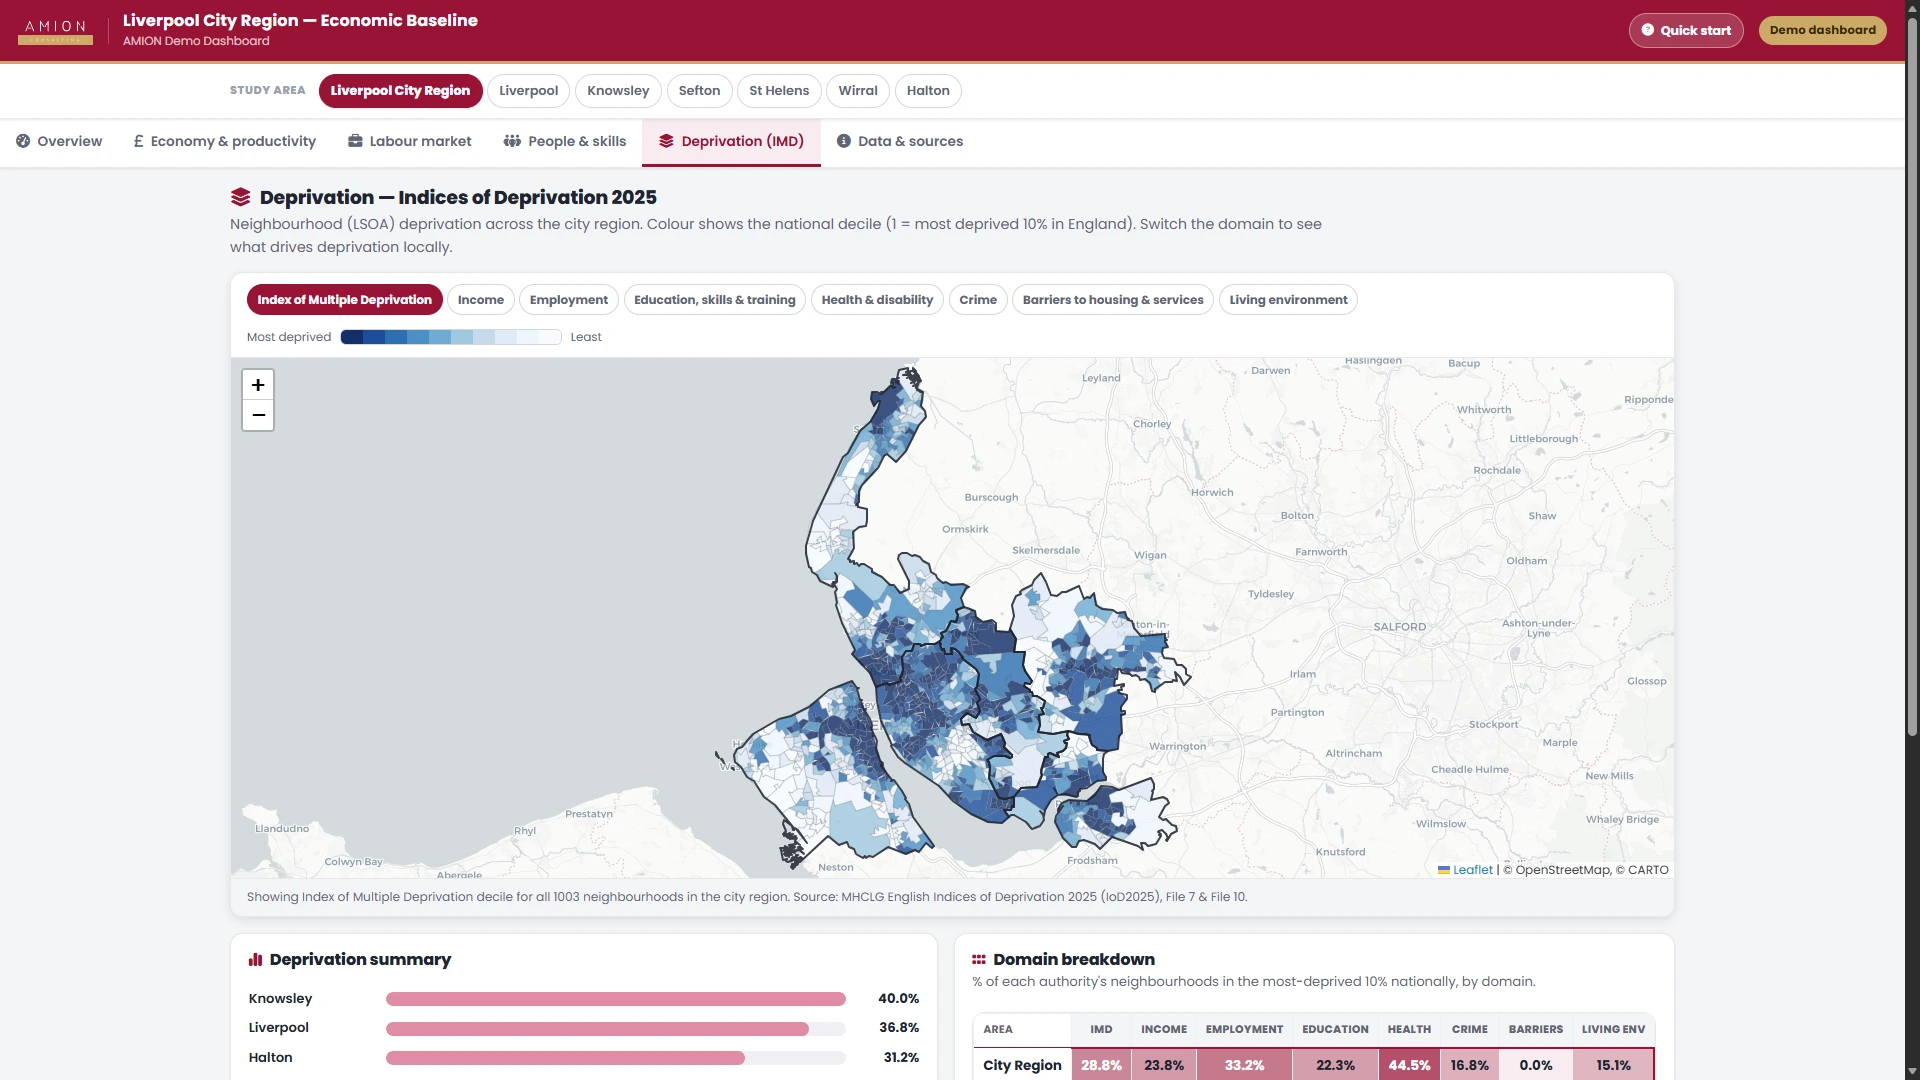
Explore economic, demographic and place-based data for defined areas through a visual, interactive interface.
"We found the dashboards extremely helpful when briefing elected members."
Mark Rizk
"The dashboards have been a valuable tool, combining clear presentation of evidence with a high-quality Welsh-language interface. It's a great innovative method of engagement."
Elliw Alaw Hughes

"The dashboards were extremely effective in presenting key insights, supporting discussion, and informing decision making."
Ranbir Mander

Book a short call to discuss your dashboard requirements. Alternatively, email us at simondancer@amion.co.uk.